As above, so below (sometimes)
The Canadian Atlantic Bottom Observations Temperature-Salinity (CABOTS) data product provides seasonal sea floor temperature (SFT) and salinity (SFS) from 1980 to 2024, all within 3 easily accessible NetCDF files. Using a novel inverse distance weighting interpolation methodology, combined with both temporal and spatial checks, we ensure that end users are provided with high-confidence results that are ready to be used. CABOTS provides a unique opportunity for researchers, governments, and industry by allowing for efficient results based upon real-world observations, not model output. A sample of what CABOTS can do is provided below.
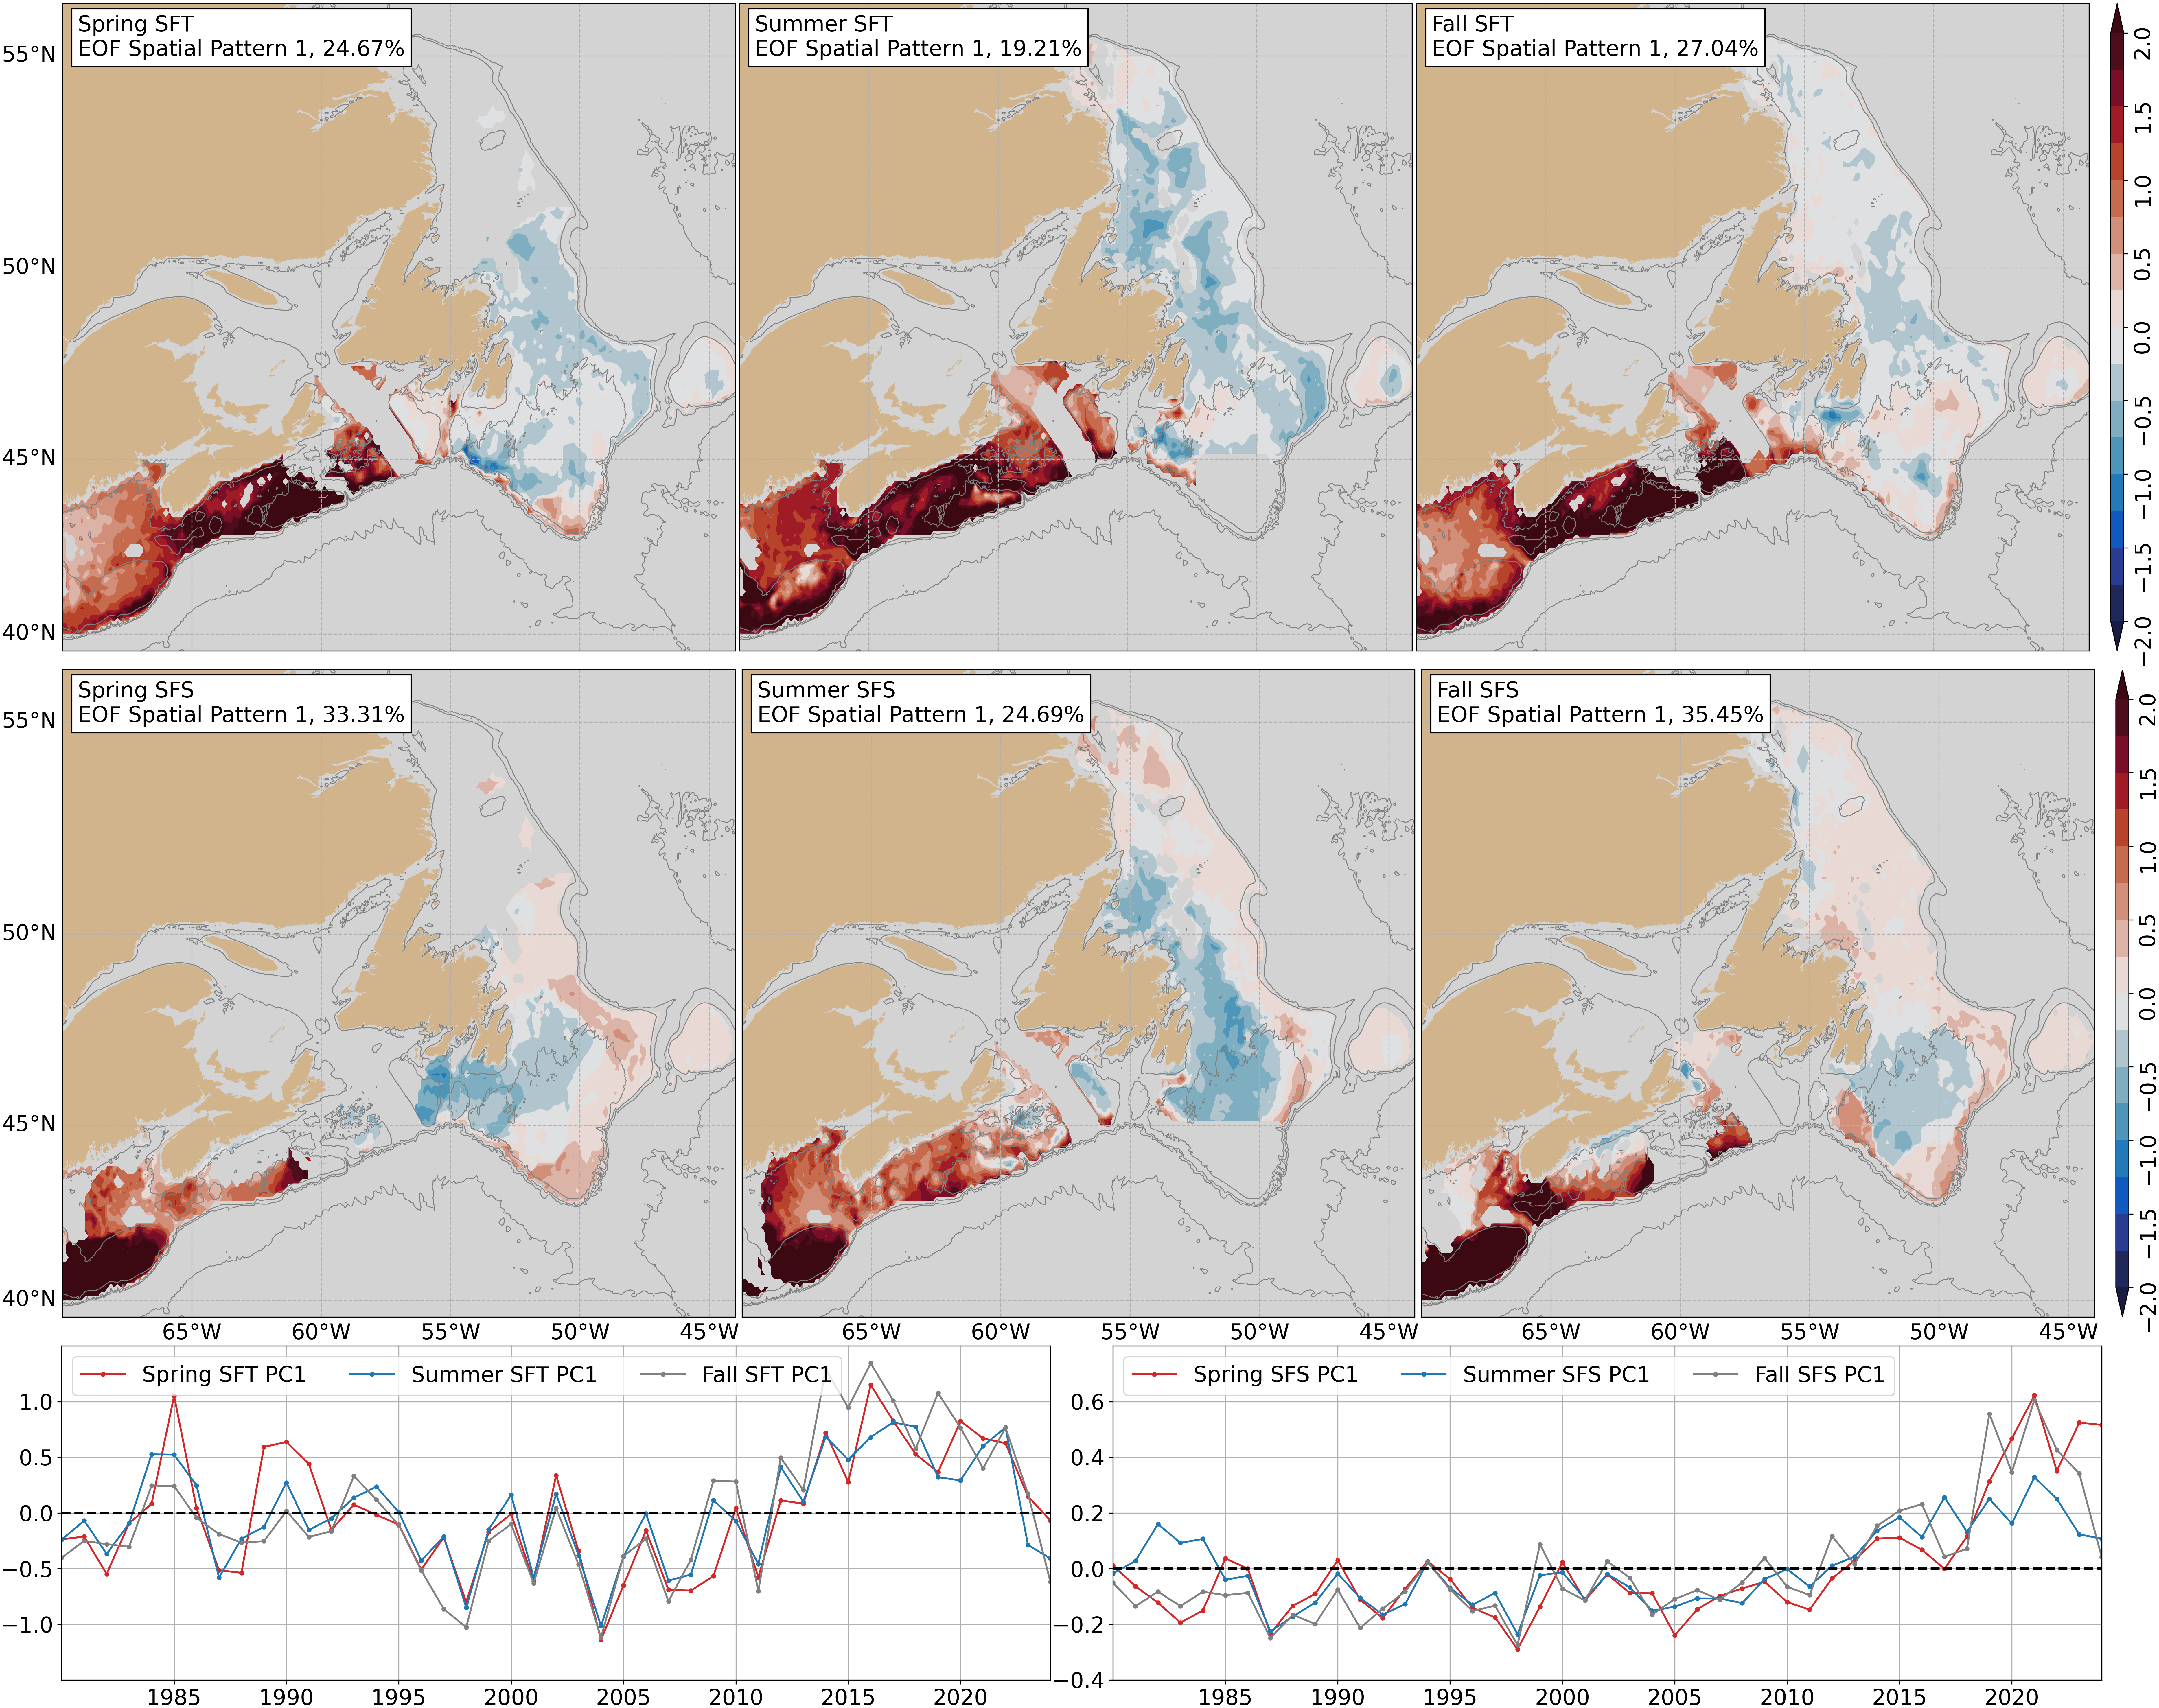
Yearly-to-decadal variations in SFT and SFS are far less studied when compared their surface counterparts mainly due to the increased difficulty in obtaining measurements. This does not mean that such variability is not important, especially regarding its potential impact on marine life and economically important fisheries (i.e. Atlantic cod, lobster, snow crab). Following well known methods for determining surface temperature and salinity variability, an empirical orthogonal function was carried out for each season, from 1980 to 2024. The leading mode was then plotted (SFT in the top row and SFS in the middle row), along with the accompanying principle component time series (bottom row). The percentage of explained variance is given with each of the plots.
The leading SFT and SFS modes account from 19% to 35% of explained variance for every season. A similar EOF spatial pattern can be seen in SFT and SFS regardless of seasons, with high positive values located around the Gulf of Maine, Scotian Shelf and Western Grand Banks. Depending on spatial coverage, positive values can also be seen throughout the Grand Banks and Gulf of St. Lawrence, although they are usually closer-to-zero. The near-shore Gulf of Maine consistently has lower values when compared to the Gulf of Maine shelf break. Similarly, the western Grand Banks shelf break show higher values when compared to shallower regions in the same area. The Scotian Shelf shows consistently high values throughout the near shore area and shelf break.
The associated PC time series show small variations around 0 in both SFT and SFS, before steadily increasing starting around 2005. 2023 shows a decrease across all seasons and variables. Good agreement is seen across all seasons is seen in the leading mode with all PC time series having correlation coefficients greater than 0.85.
Good agreement can be seen across all seasons for both SFT and SFS, both spatially and temporally. The increase in SFT and SFS seen in recent years occurs at the same time as the Gulf Stream has been observed shifting northwards, producing higher-than-average number of eddies.